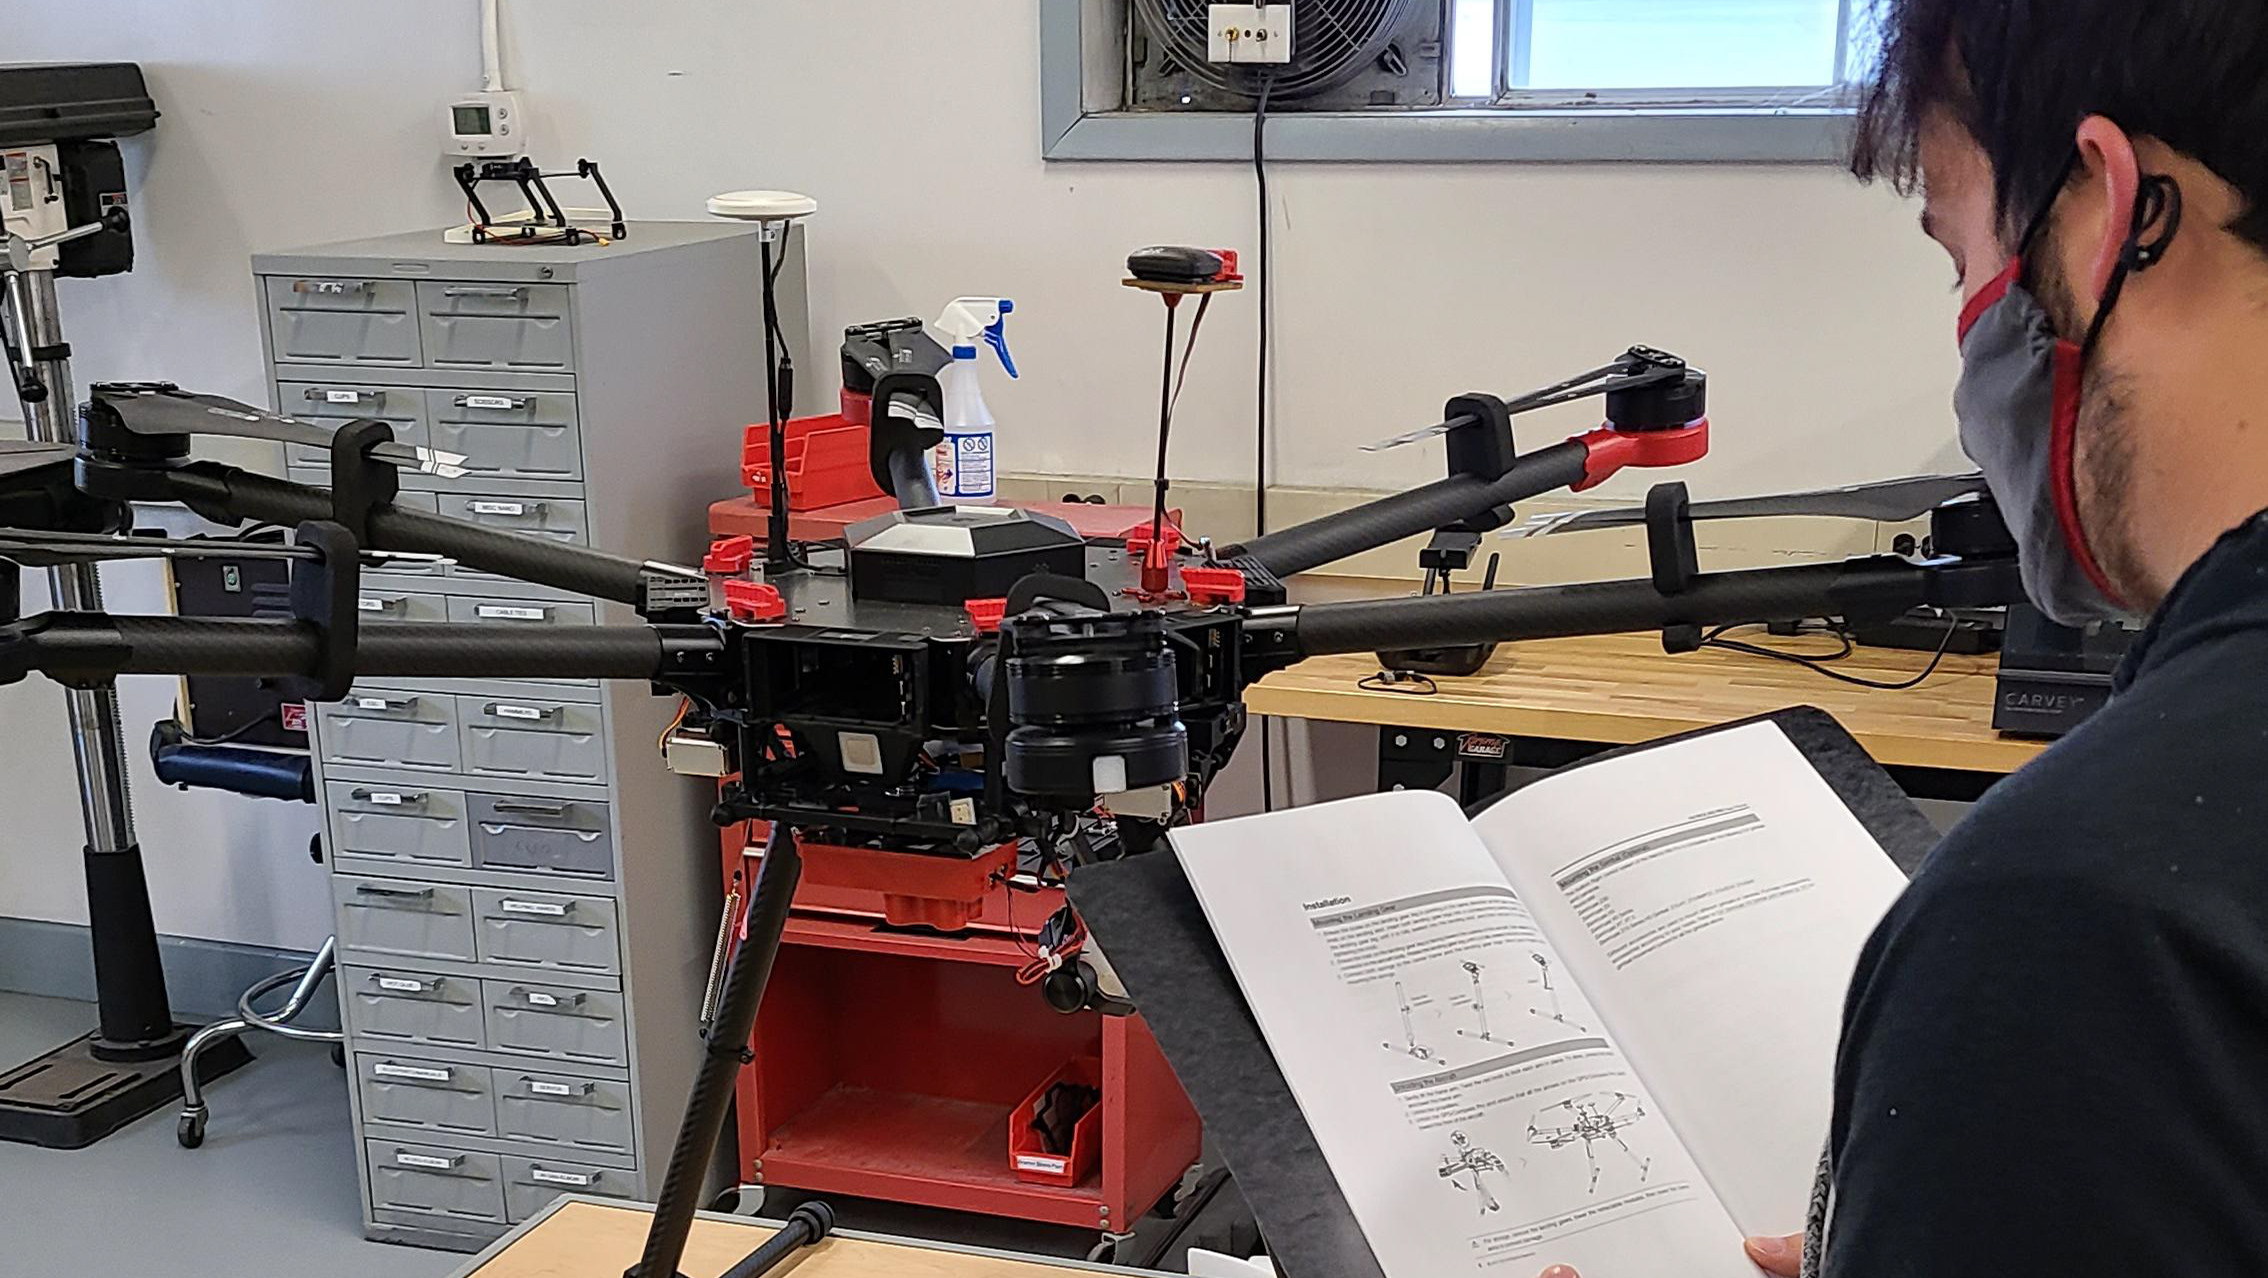
This blog post is a recap of what I learned during my Junior Fall Semester in the AT309, "Introduction to UAS Sensor Technology", class taught by Dr. Joesph Hupy. The key focus of this class was to apply core remote sensing and geospatial concepts to UAS workflows. Each week is broken down into their own sections, except for weeks 10, 11, and 12, which were primarily lectures and in-class guided tutorials. Images of relevant material are included in each section as needed.
It also is important to note that all of these weekly recaps were originally written back at the time of the class. Some have been modified in order to fit the new format of this post, as each weekly recap was originally posted individually in their own separate page.
AT309 Week 3: Intro to Pix4D and Photogrammetry Basics
Week 3 saw our class be introduced to some basic concepts on data collection and data processing. To start students were asked to read SFM in the Geosciences: Chapter 4- Structure from motion in practice pages 61-75. This reading material provided some fundamental yet important notes on collecting imagery for use in 3D modeling. This includes things like, trying to minimize shadows as much as possible, ensuring the object is still well lit, consistent spacing and angles, smooth and gradual changes to spacing and angles, and reducing blur within the images.
With these fundamental concepts understood by the class, we then moved forward into lab where we began to learn about processing a 3D model using Pix4D Mapper. Pix4D Mapper is a software application designed for processing UAS collected imagery. The software has options for both 3D models and 2D orthomosaics, DSMs, and other flat models. As a versatile and easy to use platform Pix4D Mapper was a good choice for students to get accustomed to working with data to create actual products with.
In order to practice working with data in Pix4D Mappr, Dr. Hupy provided the class with a dataset including images from a few years back captured by a DJI Phantom of his old truck. These images were capture in an orbital pattern, meaning we had most angles of the truck covered. Below you will find images of the final 3D model I generated from the imagery.
Figure 1: This is the front view of a 3D model of a pickup truck
Figure 2: This is the left side of a 3D model of a pickup truck
Figure 3: This is the back side of a 3D model of a pickup truck
Figure 4: This is a low angle view of the backside of a 3D model
Figure 5: This is the right side of a 3D model of a pickup truck.
The model has fairly high quality on both the left and right sides of the truck. This is most likely because the sides of the truck are consistently flat, and not very reflective (besides the windows). The back of the truck has very poor quality on the underside of the tailgate. This is most likely due to no photos being taken at a lower elevation where the camera could capture the area.
Differences in quality most likely come from the following factors. The angle of the photos, and lighting. The sides of the truck appear mostly good, but on the underside of the front of the truck and especially the tailgate. This is because there are no photos in the same orbital path at a lower altitude. This limits what the software can generate and leaves gray smudges where poor or no data is collected. By flying the same orbital at a lower altitude this issue could be mostly resolved. As for lighting, since the truck has many reflective glass surfaces, we see mixed quality. To get consistent quality across all the reflective surfaces, you would want to have equal, flat lighting across the whole truck. Limiting changes in reflection across each plane of glass.
AT309 Week 4: Purdue Turf Farm Data Collection
In Week 4 of my AT309 class, we were given a lab assignment to capture imagery of a large equipment shed located at Purdue Turf Farm. Students from my Thursday lab section were divided into seven flight groups, that would all capture imagery using different types of flight plans with a UAV. The different style of flight plans included flying automated grid missions at 90 and 60 degree camera angles at 40 meters, automated orbits with 45, 10, and 0 degree camera angles, both types of mission using either the flight app Measure Ground Control, or Pix4D Capture. There would also be one flight group flying, however they saw fit manually around the shed to capture imagery. The objective of this lab was to demonstrate what kinds of flight plans were optimal for capture certain types of data. I ended up placed in a flight group by myself and was given the task to fly the data collection manually.
Once everyone understood who was in their flight group and was tasked with a certain kind of flight plan, students gathered UAVs, landing pads, and safety vests and made their way out to Purdue Turf Farm. Upon arrival the weather conditions at the site were really good. There were not many clouds in the sky, which allowed for ample sunlight, and the winds were fairly calm. Around the shed there were three main obstacles to keep in consideration while flying, a large fence surrounding the shed, a tall stadium style light pole next to our takeoff and landing location, and another one a few feet behind the shed. Students began to setup to prepare to fly, when we were struck by an issue. The area the shed was in was part of Class D airspace and was in a LAANC approval zone. All PICs attempted to get LAANC approval using an application called Airmap which we had used several times in our AT219 class last semester. However, all of our requests for authorization kept getting kicked back with error messages. Due to the uncertainty of the situation, and not wanting to break any FAA regulations, the mission was scrapped for the day. Sadly, the issue with LAANC approval would not be short lived, and as summer turned to fall weather conditions became less commonly optimal for conducting flights.
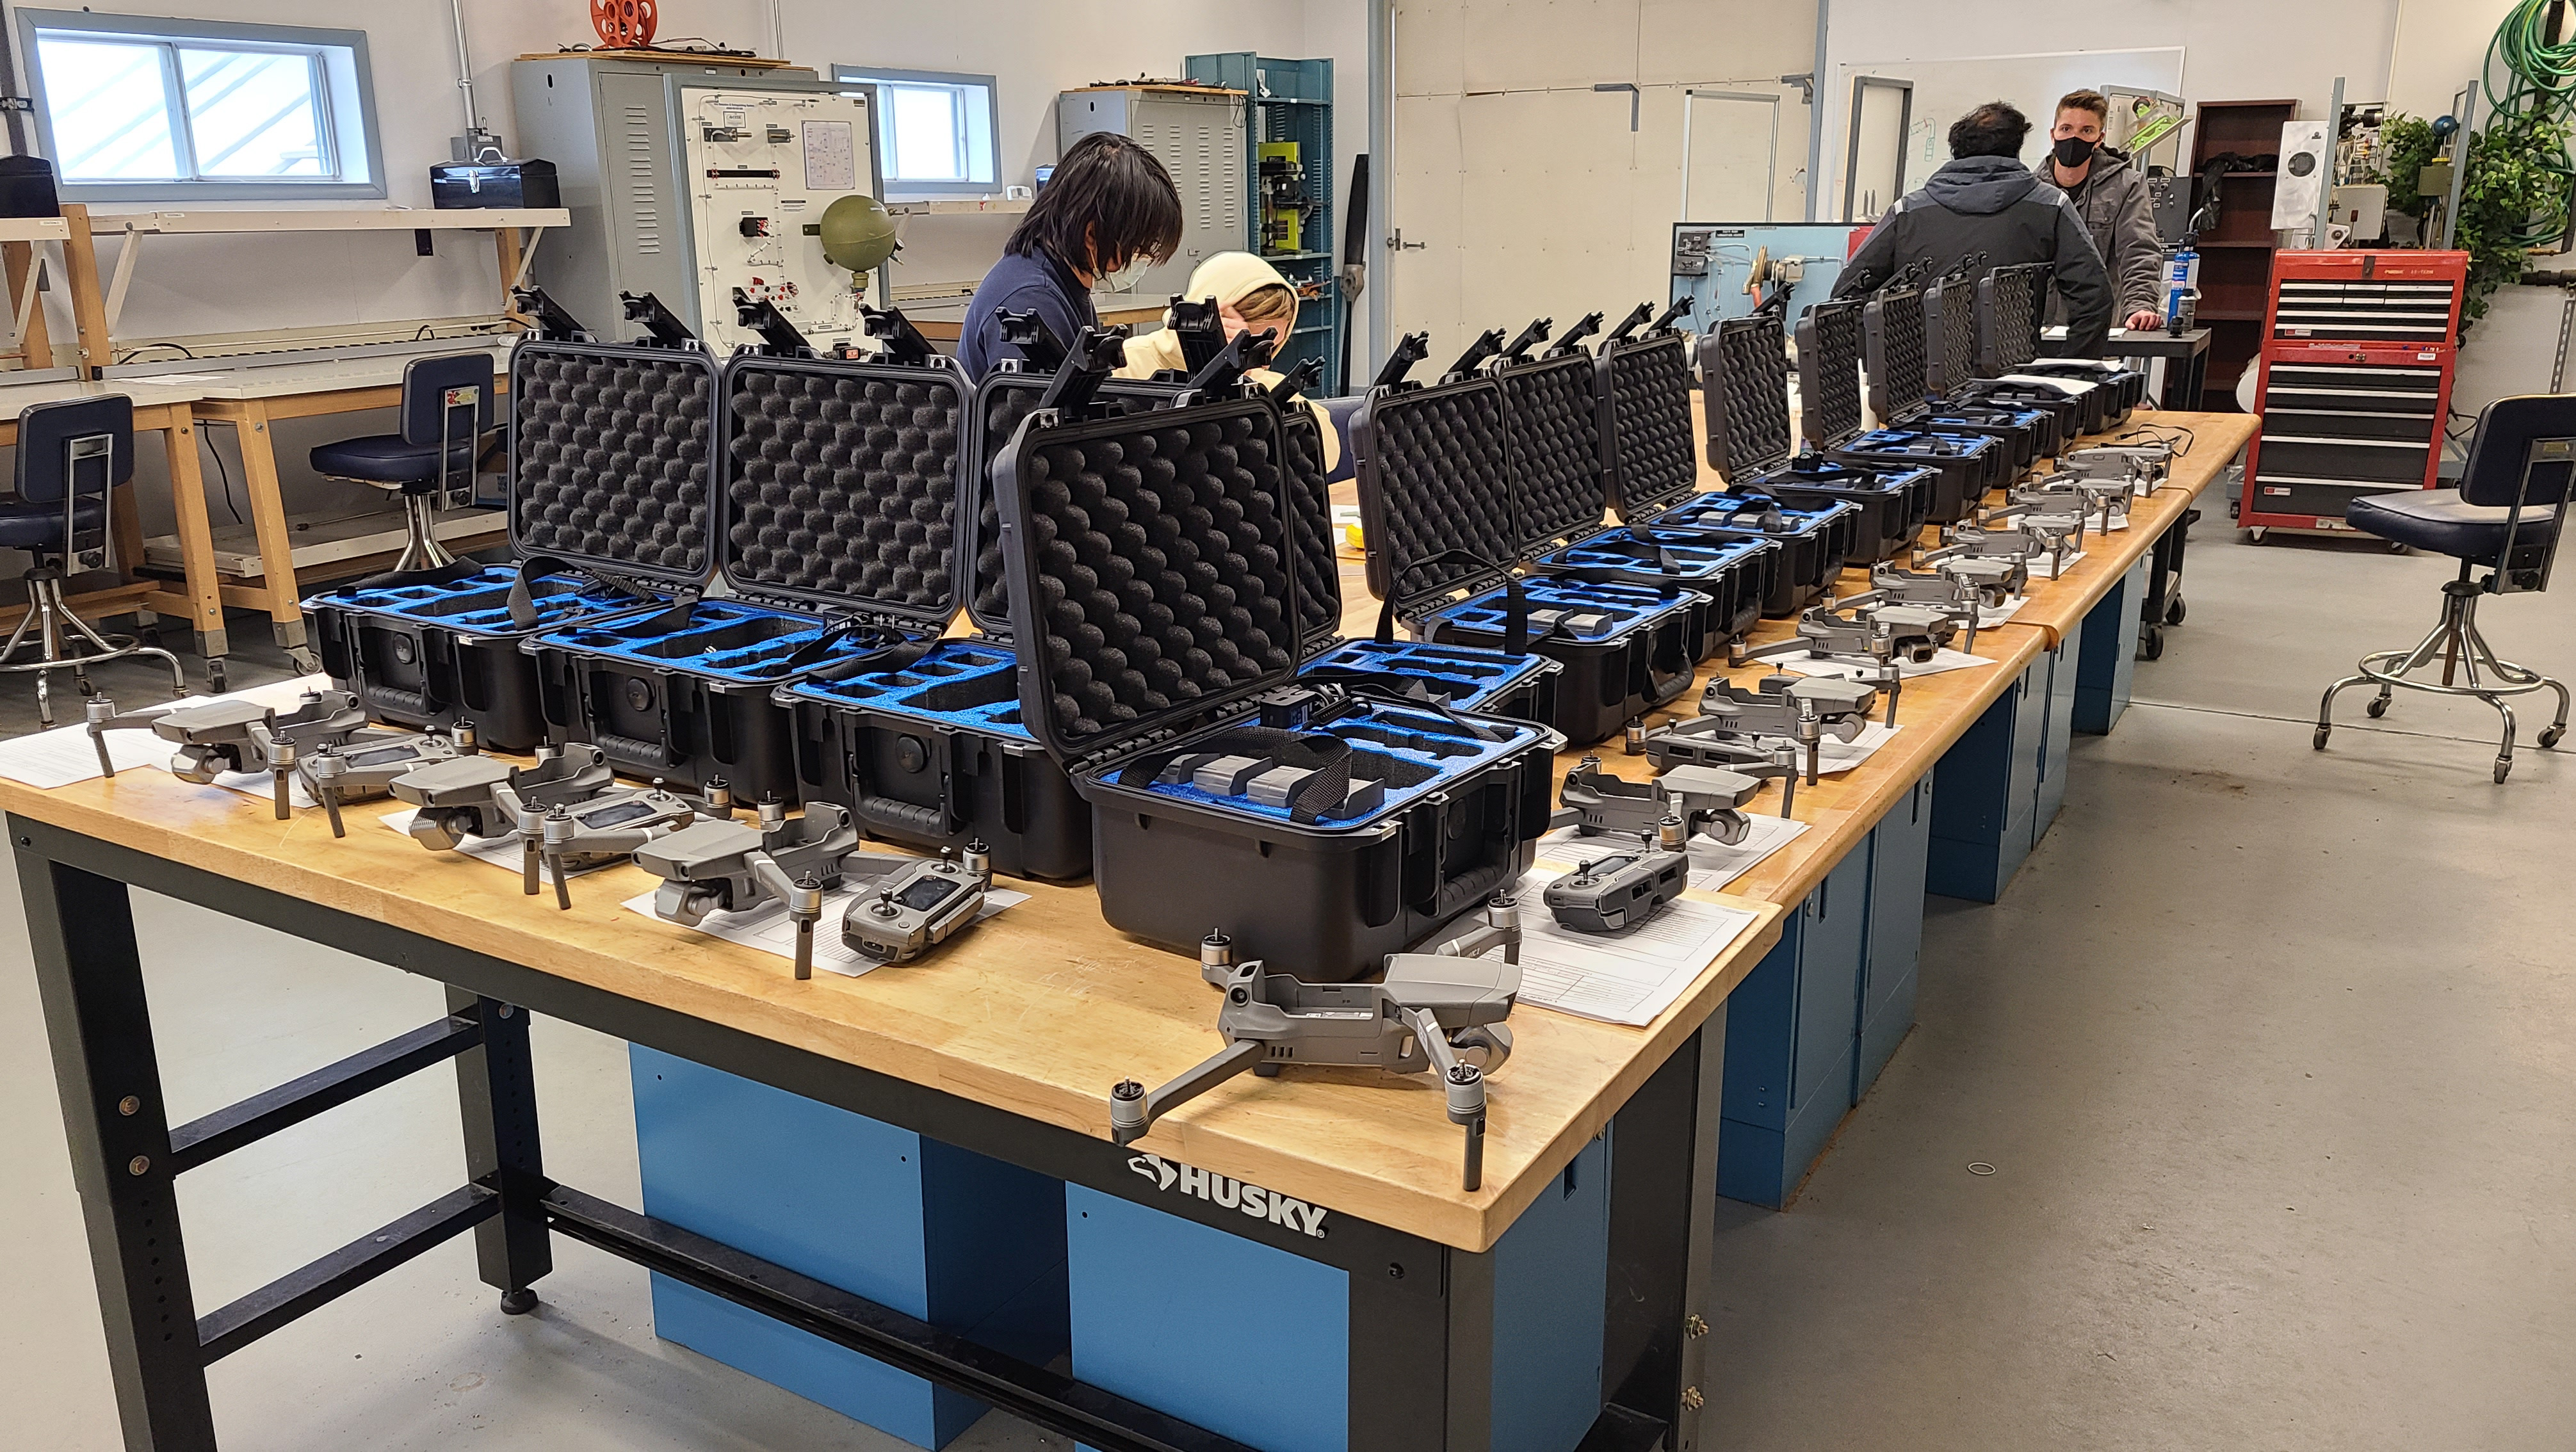
Finally on October 13th my crew (myself) went to Purdue Turf Farm to fly the large equipment shed located near the parking lot to create a 3D model. I used a DJI Mavic 2 Pro to fly the building and capture images. The images were saved to a micro-SD card. The camera settings included exposure set to EV +0 as there was plenty of sunlight. Flying manually, I stopped at each location to take a photo, which is different from the other students that flew automated missions, where speed of the flight would impact the number of images taken by the UAV.
I arrived at the flight location at 10:50am and began to set up for operations. The shed is on the other side of a fence that is over six feet tall. Past the shed on the other side of fencing there is a tall stadium style light pole. Other than these two obstacles there is nothing else in the way of conducting operations. I began setting up for my flight, and while going through settings in DJI Go 4 the aircraft indicated a compass calibration error. I took the appropriate steps to recalibrate the aircraft away from interference as best as possible. I then proceeded to take off and began my flight at 11:05am. At takeoff the weather was fairly sunny with just a few spotted clouds, and winds gusting to what felt like 10 mph. The METAR from the KLAF read however 131454Z 13004KT 10SM CLR 19/14 A2999 RMK AO2 SLP154 T01890144 58002.
I began by capturing images of the roof of the shed by attempting to fly a grid pattern over it. I flew the entire mission at 16m AGL. For this portion of the flight, I had the sensor angled at nadir. After capturing the desired number of photos of the roof, I began to fly in an orbit around the shed with the camera angled at 45 degrees. When I got to the back side of the shed, I got nervous due to my depth perception of the UAV by the light pole, and you can see where I tried coming in closer to avoid any potential collision, but then tried to correct for it. After completing the orbit, I landed and checked the number of images on the micro-SD card, which came out to be 69 images.
I brought the data collected from the flight to the computer lab at Niswonger, to process using Pix4D Mapper. I imported the photos collected and set up Pix4D to create a 3D model. From importing the images, you can see in Figure 1 below the real path of my manual flight laid over old satellite imagery of the location. Pix4D Mapper then conducts an initial test of the pictures for quality assurance. In my case the initial report indicated that the software would end up only using 57 of the 69 images. In Figure 2 you can see these images were part of my orbiting flight path and would lead to their being very little side view data. This is upsetting as the areas where data was collected, we can see the model of the shed has fairly good detail, as such in Figure 3 and Figure 7. There may be a way to go through the project settings of Pix4D Mapper to force it to use the other images, however at the time of processing this is not something we have covered in class.
Figure 1: PTF Shed manual flight path
Figure 2: Red cameras indicate the location where images were not used due to Pix4D determining them to be “uncalibrated”
Figure 3: Front view of shed model
Figure 4: Left side view of shed model
Figure 5: Back view of shed model
Figure 6: Right side view of shed model
Figure 7: Top view of shed model
AT309 Week 5: Remote Sensing Photography Fundamentals
This week we covered some more in-depth fundamental information on remote sensing data collection. In lecture we focused on the electromagnetic spectrum and how energy is at the heart of the data we are collecting. While no expert on the electromagnetic spectrum this was a primarily a review for me on the topic, based on what I had learned in high school. Lecture covered different types of energy, the different segments of the spectrum and what they are commonly used to see, and relations of heat and energy. Dr. Hupy also covered some parts of particle theory, Stephan-Boltzman Law, and Wein’s Displacement Law.
In lab we used ESRI Landsat App and completed a tutorial called "Getting Started with imagery: Explore 40 years of Landsat Imagery from around the World". This would have us working with different forms of Skatalite imagery to have a more grounded understanding of concepts taught in lecture. This happened to be a bit of a repeat for me as I also am in another remote sensing class called FNR 357, where we worked with satellite imagery to understand similar concepts.
In the first part of the tutorial, we worked with color infrared imagery. Color infrared is a band combination, which combines the bands 5, 4, and 3 (or Near Infrared, Red, and Green). Using this band combination, you can clearly distinguish between vegetation and non-vegetation features. Healthy vegetation will appear as a bright red color. This helps healthy vegetation stand out as things like farmland with sparser vegetation will appear in a lighter shade of red, separating the two different geographical features out.
Figure 1: Sundarbands preserve shown in Color Infrared (from LANDSAT)
Figure 2: Purdue University shown in Color Infrared (from LANDSAT)
*ESRI does not let you zoom into higher detail over Purdue University*
The next part of the tutorial was to move to the Oasis view section. We viewed the satellite data as an index. An index is a way of simplifying what is otherwise complex information. Using the moisture index, we are able to better differentiate wet areas from dry areas, similar to how color infrared was able to differentiate healthy vegetation from low vegetation areas. The areas of high moisture now become bright green in color revealing the moisture is being utilized by farmers to grow crops. Crops need water/moisture to grow, so it is not surprising that we see crops growing in areas with high moisture but nowhere else throughout the rest of the dry desert.
Figure 3: LANDSAT Mositer Index photo of an oasis in Takla Makan Desert
Figure 4: LANDSAT Agricultural view of southern California
The next part of the tutorial had as looking over the Suez Canal. This segment was to teach about temporal resolution. Temporal resolution referrers to changes seen by comparing and contrasting imagery of a single area over an extended period of time. At this point in the tutorial, Dr. Hupy asked the class to think about how UAS would play into gathering data from a temporal perspective.
I believe gathering data continuously over a period of time at the same location with a higher quality spatial resolution (or GSD), using UAS imagery will provide you with the ability to gather much more continual data, that gives you insight to the more granular changes over time. To accomplish this, you would need ample data storage on the UAV itself, a place for long term raw and processed data storage, flight planning software that would allow you to repeat the same mission, and GPS ground base stations to help align the imagery with where specifically topographical features are in the real world.
Figure 6: Las Vegas, NV in Color Infrared from 5/12/1975
Figure 7: Las Vegas, NV in Color Infrared from August 9th, 2021
At the end of the tutorial, we were asked to reflect on the tutorial as a whole, and how what we learned applied to UAS.
1. What do satellite imagery, UAS imagery, and manned aircraft imagery share in common?
a. All imagery from each of these platforms can be collected from a variety of sensors including rgb, multispectral, hyperspectral, etc. These platforms also can capture imagery pointed nadir which allows for the data to be used to make maps.
2. What advantages do satellites have over UAS? What about disadvantages?
a. Satellites are able to capture imagery over a much larger area than any commercial UAV would be capable of capturing in a day. However, a UAV is capable of capturing data at a much higher spatial resolution than satellite can.
3. Thinking of both these questions, what niche does UAS fill between satellite imagery and manned aircraft imagery?
a. UAS fills a niche of high-resolution data in relatively smaller areas, with the need to capture data multiple times in a week/month.
4. Finally, do you think UAS will eventually replace the need for satellite imagery? Why or why not? Please qualify your answer with a valid argument.
a. UAS will not replace satellite imagery all together for quite some time. Until commercial UAVs are capable of flying for longer durations and have regulatory approval to fly in higher airspace and beyond visual line of sight, the need for satellites. However, if regulatory approval does occur for both of those things, and the price of imagery is comparable to that of satellite imagery, then I think UAS will replace them. With higher resolution, and the ability to capture data anywhere in the world at a moment's notice would prove to be extremely valuable. I sadly think regulation will stand in that future’s way for decades to come.
AT309 Week 6: Grid Mission With Vehicles
For Week 6 of my AT309 lab we were once again broken up into flight groups and were tasked with flying a specific mission. This time we would be flying out at Purdue Wildlife Area (PWA) and would be flying over a grassy area where we would park a few of the student's cars. The objective for these flights was to collect imagery using different types of flight plans in order to generate orthmosaics and digital surface models (DSM). There were once again seven different flight groups for the Thursday section of lab, in Figure 1 you can see the breakdown of these groups and what type of flight plan they were assigned. I was in a flight group by myself and was tasked with flying a single grid with the camera sensor pointed nadir.
Figure 1: Flight group assignments and assigned flight plan type
Once everyone had their flight group, and assigned flight plan type we collected equipment for the mission from the lab. Equipment for this mission would consist of a DJI Mavic 2 Pro to fly the mission, a landing pad, Purdue safety vest, and a micro-SD card for storing the captured images. Our professor Dr. Hupy also grabbed the ground control points (GCPs) to put them out in the area we were collecting data, in case he decided to use the data we collected from these missions, to teach us about processing imagery using GCP location data. Once all equipment was gathered students split up into vehicles and made their way out to PWA.
After arriving to PWA six vehicles were moved into the intended flight area, and students began to setup for their missions. The weather at PWA upon arrival was fairly good. There were only a few hazy clouds in the sky, and winds were relatively calm gusting less than 5mph. The missions were to be flown using a flight app called Pix4D Capture. Students used this software in the field to also create an automated flight while in the field. My flight plan was set at an altitude of 10m AGL, with 80% overlap of imagery, and camera sensor pointed nadir. I found the controls for this app to be a bit finicky, as trying to zoom in and out of the satellite view of the area would cause it to scale my flight plan, either increasing or decreasing its total area covered.
I eventually got my flight plan sorted out and prepared to take off. I started the mission using Pix4D Capture, and the UAV lifted off, gained altitude, and proceeded to fly straight and fast at the nearby tree line. This tree line was the only true obstacle in the area of the intended flights and was roughly 50ft away. Calmly I watched the UAV fly for a few seconds before determining there must be something wrong, and stopped the flight by switching the flight mode on the controller, which is a failsafe for stopping any kind of automated flight plan immediately. Upon evaluation of the flight plan on Pix4D capture again, the issue I expressed having in the previous paragraph appeared to take hold again, as now without my direct input the flight plan had grown to cover a much larger area then I intended to fly. With help from my professor and the class teaching assistant, I attempted to rescale my flight plan yet again. I then proceeded to carefully initiate the mission again, and this time all went smoothly. The flight lasted for 7 minutes and 20 seconds, and collected 180 images.
With the imagery collected, I brought it back to the computer lab at Niswonger, and imported it all into Pix4D Mapper. After importing all of the images, Pix4D began an initial quality assurance test, and gave back a report that indicated it would only use 140 of the 180 images collected. The report stated that 40 of my images were “uncalibrated”. Below in Figure 2 you can see the locations of which images were not used when processing. With the remaining images I set Pix4D Mapper to go ahead and process the orthomosaic and DSM as assigned to us for this lab, however I also had it generate a 3D model using the images as well just to see what the result would look like.
Figure 2: Red cameras indicate which images were not used in the processing
Of the intended flight area, most of the target area for data capture made it into the final processing. In all data products, the six cars are clearly visible. The only part of the flight area that was cut out was the northeast portion which only included some more of the grassy plot. The resolution of the orthomasic (Figure 3) is also great enough that you can easily pick out the location of the five GCPs that were placed out by Dr. Hupy. The DSM (Figure 4) also accurately portrays how the vehicles in the imagery are taller than anything else in the captured imagery. As for the 3D model (Figure 5) constructed from the images we can see the quality is fairly poor. Since the flight plan was a grid mission, flown with the camera pointed nadir, we don’t have any good side imagery of the vehicles (Figure 6). This leaves them looking warped or melted. The grass also doesn’t appear highly detailed for the same reason above, and due to slight movements occurring do to wind.
Figure 3: Orthmosaic generated from imagery collected from flight
Figure 4: Digital Surface Model (DSM) generated from imagery collected from flight
Figure 5: 3D model generated from imagery collected from flight
Figure 6: Close up of vehicles generated in the 3D model
AT309 Week 7: PWA Missions and Intro to GCPs
On October 7th, 2021, the Thursday AT309 lab group were divided into their flight groups and assigned flight plans constructed by Dr. Hupy. These flight plans were set out at Purdue Wildlife Area (PWA) and would see the student groups flying a plot of land and various altitudes, with ground control points (GCPs) played out in the area for future data processing and learning opportunities. There were seven total flight groups in the Thursday lab, and each group flew at 50-foot difference in altitude starting with flights at 100 feet above ground level (AGL) and ending at 400 feet AGL.
Before gathering our equipment, and heading out to PWA, Dr. Hupy had all flight groups recreate the mission he created in the flight app Measure Ground Control, using the flight app Pix4D Capture. This was done to ensure all groups had a backup flight plan in case for one reason or another issues occurred when attempting to use the flight plans, he created or a compatibility issue with a group's device. Dr. Hupy evaluated all backup flight plans, and then all students collected equipment. For these missions we would be using a DJI Mavic 2 Pro and capturing the images to a micro-SD card. I was in a flight group by myself, so I grabbed a UAV, and safety vest and proceeded to drive to PWA.
I arrived at PWA around 2:25pm and the weather conditions upon arrival were a fairly cloudy, and a slight breeze. As time would go on the clouds would begin to roll out, and by the time I conducted my flight, it was mostly sunny. There were no obstacles in the way of my flight plan, except for some trees that were behind my take off spot several feet, and only are around 80 feet tall. My mission was to fly at 400ft, with 80% front lap, and side lap, and the camera pointed nadir. The speed of my flight was set to 10mph and had an estimated duration of 1 minute 43 seconds. I conducted my first attempt of the mission with some success. My first attempt completed the flight plan properly, but after landing and reviewing the images for quality assurance, I found they were fairly darker than expected. I went into the manual camera settings of the UAV and found that the EV value had been set by the last pilot to be –2.0. It was my fault for assuming the automatic flight plan would correct this with its own settings. However, since I caught the error while still in the field, I was able to simply, and quickly re-fly the mission again. The second time I launched the UAV at 3:04pm and landed at 3:09pm, with flight plan itself taking 1 minute and 43 seconds again. I rechecked the images again and this time they turned out a bit brighter than before.
The data collected during this flight has yet to be used to generate any kind of data products, however as stated previously there is intent by Dr. Hupy to revisit this data in the future. When we reach the point where we learn about processing data using GCPs as location reference the data that each flight group collected will be good examples to work with. At this time though when this will be is undecided, and so all students have been asked to hold onto the data in the meantime.
AT309 Week 8: Fall Break
For Purdue University, Week 8 this semester marked where Fall Break was scheduled. Because of this class was not held, and there was no assignment due.
AT309 Week 9: 3D Model Presentation
Week 9 saw students presenting their final generated products from flights conducted during lab for Week 4 and Week 6.
AT309 Week 10, 11 & 12
Week 10 was an introduction to the software application called ArcPro. In classes this week we were given an introduction to different features and how to work with some sample data products. Week 11 had students learn about coordinate systems and projections. As a part of this lesson students were asked to complete the Esri "Introduction to Coordinate Systems" online course. Finally, Week 12 was an introduction to geographic referencing and datums. In lab for this week, students were tasked to identify the errors of, and fix a ground control point (GCP) file.
AT309 Week 13: Using GCPs to Process Data
In Week 13 our class went back to our data that we collected in Week 7. As mentioned in the Week 7 blog post, GCPs were introduced and placed out in the field during our flights. Dr. Hupy wanted for us to cover projections and coordinate systems before attempting to process the data using those GCPs. Now that our class has covered those topics, we were ready to begin learning to process with the GCPs inside of Pix4D Mapper.
As a recap from Week 7, here is how my flight went during that lab:
"I arrived at PWA around 2:25pm and the weather conditions upon arrival were a fairly cloudy, and a slight breeze. As time would go on the clouds would begin to roll out, and by the time I conducted my flight, it was mostly sunny. There were no obstacles in the way of my flight plan, except for some trees that were behind my take off spot several feet, and only are around 80 feet tall. My mission was to fly at 400ft, with 80% front lap, and side lap, and the camera pointed nadir. The speed of my flight was set to 10mph and had an estimated duration of 1 minute 43 seconds. I conducted my first attempt of the mission with some success. My first attempt completed the flight plan properly, but after landing and reviewing the images for quality assurance, I found they were fairly darker than expected. I went into the manual camera settings of the UAV and found that the EV value had been set by the last pilot to be –2.0. It was my fault for assuming the automatic flight plan would correct this with its own settings. However, since I caught the error while still in the field, I was able to simply, and quickly re-fly the mission again. The second time I launched the UAV at 3:04pm and landed at 3:09pm, with flight plan itself taking 1 minute and 43 seconds again. I rechecked the images again and this time they turned out a bit brighter than before."
Now that we have reviewed that, we need to establish the characteristics of the data collected. The Geographic Coordinate System is NAD83, the Projected Coordinate System is UTM zone 16N, the EPSG code is 6345, and the Geoid Model is EGM96. The class was also provided with a file called GCPs_100721_Nad832011UTM_geoid12b_simple for being able to import the GCPs into our processing. You may also want to know, or need to know, if you are working with a different software the specifications of your camera. Luckily Pix4D Mapper was able to automatically detect the camera used in our imagery, and those specifications are shown in the figure below.
Figure 1: Mavic 2 Pro camera parameters imported by Pix4D Mapper
To begin we were asked to process the data without the GCPs and to make both a 3D model as well as orthomosaic and DSM. Following the same processes, we used in Weeks 4 and 6 I was able to easily generate those products. Also, with my flight being at the highest altitude, means I had fewer images (19 images total) and had much faster processing times in comparison to some of my classmates. Below you will find an image of the 3D model generated with the Week 7 data without the use of GCPs.
Figure 2: 3D model without the use of GCPs
From there I then moved on to process the data now with the GCPs. In terms of what is different in the process, you have to do a few more things. Firstly, change the default coordinate system to the projected coordinate system the GCP data is in. This can be done easily by inputting a related EPSG number, if you have one. Secondly, you must ensure that your outputted product also matches this coordinate system. Once you ensure you've done this, then process like normal. After its finished processing you'll go through and for each GCP you will manually select on a few images where the GCP really is versus where it was automatically placed by Pix4D. You will also remove the 6th GCP point. After doing this sudo-calibration you will reprocess the data to correct the GCPs. Once the reprocess is completed the new map came out looking like it does below.
Figure 3: 3D model with the use of GCPs
Figure 4: Close up of GCP marker on 3D model
Something odd about this new model is how curved it is. While I do not have an explanation at this time for why it may be, several other students also saw some level of curve applied to their GCP corrected models as well. As it is obviously the effect of the GCPs, I will include the geolocation info chart below here, in case it may prove to shine a light on the reason at some point in the future.
Figure 5: Geolocation details of 3D model
AT309 Week 14: Happy Thanksgiving
With Week 14 being during Thanksgiving Break here at Purdue University classes were not held and no assignment was due.
AT309 Week 15: Making Real Maps
For Week 15 we learned about how to take our aerial images, and data products and turn them into cartographically correct maps. Dr. Hupy gave a brief lecture, going of characteristics of a cartographically correct map. This includes having the following cartographic elements, title, north arrow, scale bar, locator map, watermark, data sources and metadata, and a legend. In the metadata section of the elements you want to include the pilot of the flight, the platform flown, sensors used to collect imagery, and the altitude of the flight. Proper cartographic skills are essential in working with UAS data as it allows you to develop maps that can be confidently delivered to clients or the public, in which they are self-explanatory and easy to read. If you do not have proper cartographic skills then the map you create could cause confusion, misunderstanding, and potentially devastating mistakes for those using them. These mistakes would leave you liable for providing a product that is either inaccurate or of poor quality.
Dr. Hupy followed lecture up with an in lab demonstration about how to do this in ArcGis Pro. In his demonstration he used a dataset of a mining location, which had GCP points. With this data he worked through navigating the software, working with the data/ data analysis, and building a map. At this time Dr. Hupy also took a moment to reinforce the importance of proper file naming, and data management.
File naming and management is important, because you may have to pass off data to someone else to work with and by having this information readily available in the name scheme, it allows them to understand what data has been handed over to them, and easily refer back to it later. When naming your project data folders you should include the date of the flight, your name, location, altitude, and if it has GCPs.
For our lab we were asked to use the data we worked with and processed in Week 13 to create a map of our own. Using the generated orthomosaic from this data set I put together the following map.
