Introduction
When you need to dig something up, you have a variety of options to accomplish the task. If you know where something is specifically, you may use a shovel. If you are unsure where something is, and need to cover a large area, you might use an excavator. This is the difference between multispectral and hyperspectral data collection. Both types of remote sensing data collection have uses involving the understanding of the world around us, but they often get conflated when they are very different technologies. In this post I will break down the differences between these two technologies as well as cover remote sensing in broader terms.
Introduction to Remote Sensing
To begin we will set the stage by identifying what remote sensing is. Remote sensing is a non-destructive and non-invasive way to collect information about the physical characteristics of an area. Typically, this data is collected by satellite or aircraft. A variety of different sensors are used to collect data for different purposes, but in simple terms the goal is to collect information on a scale and of a variety that we cannot observe from one location on the ground (What is remote sensing and what is it used for?).
As mentioned, satellites are often a tool used to carry sensors for remote sensing. These satellites offer extensive coverage of the Earth, however the tradeoff of this wide variety of coverage is spatial resolution of the collected data. While newer satellites can carry more optimized and high-quality sensors, this data often will cost a high price to get access to. Publicly available data, for free or low-cost, is often exclusively measured in square meters. A common satellite to see data in the public space is known as Landsat 8, which provides 15-meter resolution panchromatic data and 30-meter resolution multispectral data (Landsat 8). This means a single pixel in the image is at best representative of a 15-meter by 15-meter area for panchromatic imagery. Panchromatic imagery are images made by combining individual red, green, and blue band data and merging it into a higher resolution gray image that can be used to sharpen lower resolution images.
Satellites have been very useful over the years for commercial and research purposes, however there are a variety of issues with data from satellites. Data collected from satellites needs to be corrected, to compensate for Earth’s atmosphere, which can cause additional noise in the imagery. Just as the atmosphere gets in the way, clouds can also block the view of a satellite as well. This leads to an inability to always collect imagery when you want, and satellites usually do not maneuver from their established orbit, as doing so impacts the total life cycle of a satellite.
If we desire to collect data on a more consistent timeline, with lesser worry on cloud cover and atmospheric correction, manned aircraft are capable of filing this role. Manned aircraft are still capable of carrying high quality sensors, with the added benefits of more reliable data capture, and the possibility of an increased rate of data collection. The spatial resolution of data from sensors onboard of manned aircraft will often be higher than the data collected from satellites. There are still some drawbacks to the use of manned aircraft, however. The main drawback is that the price can still be quite high for this type of data collection, and you will likely be the owner of at least the sensor, if not the aircraft as well. Additionally, while the data quality is normally higher than satellite data, the spatial resolution of the data may still be too low for some use cases.
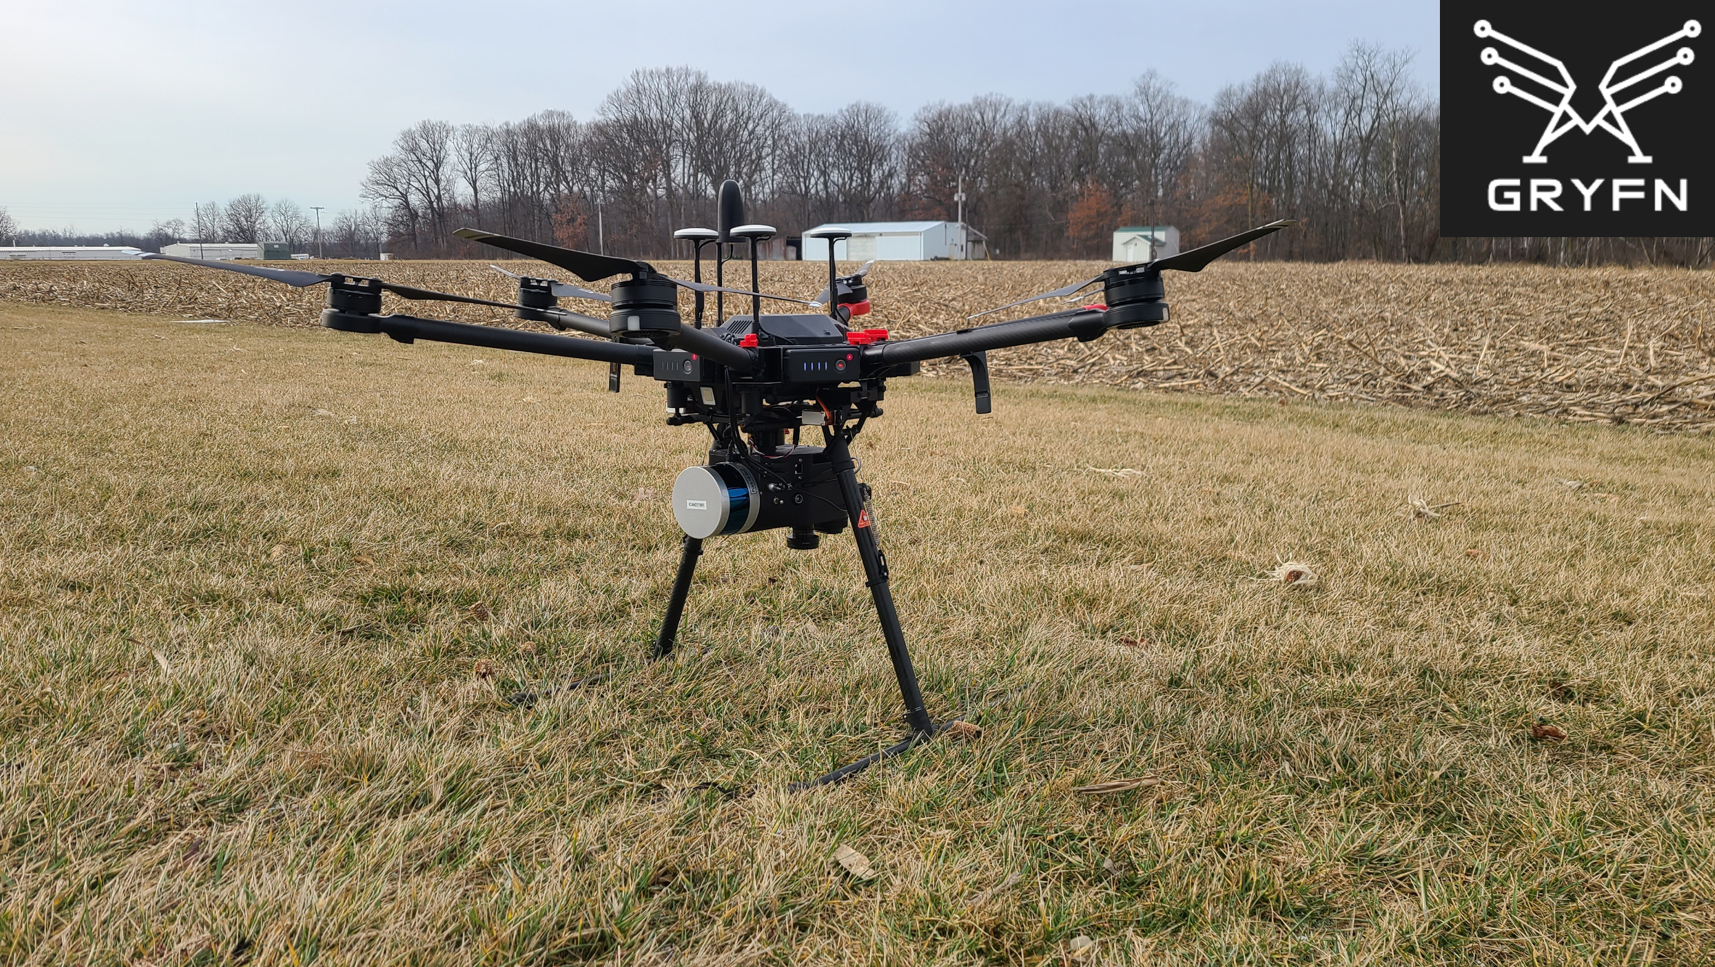
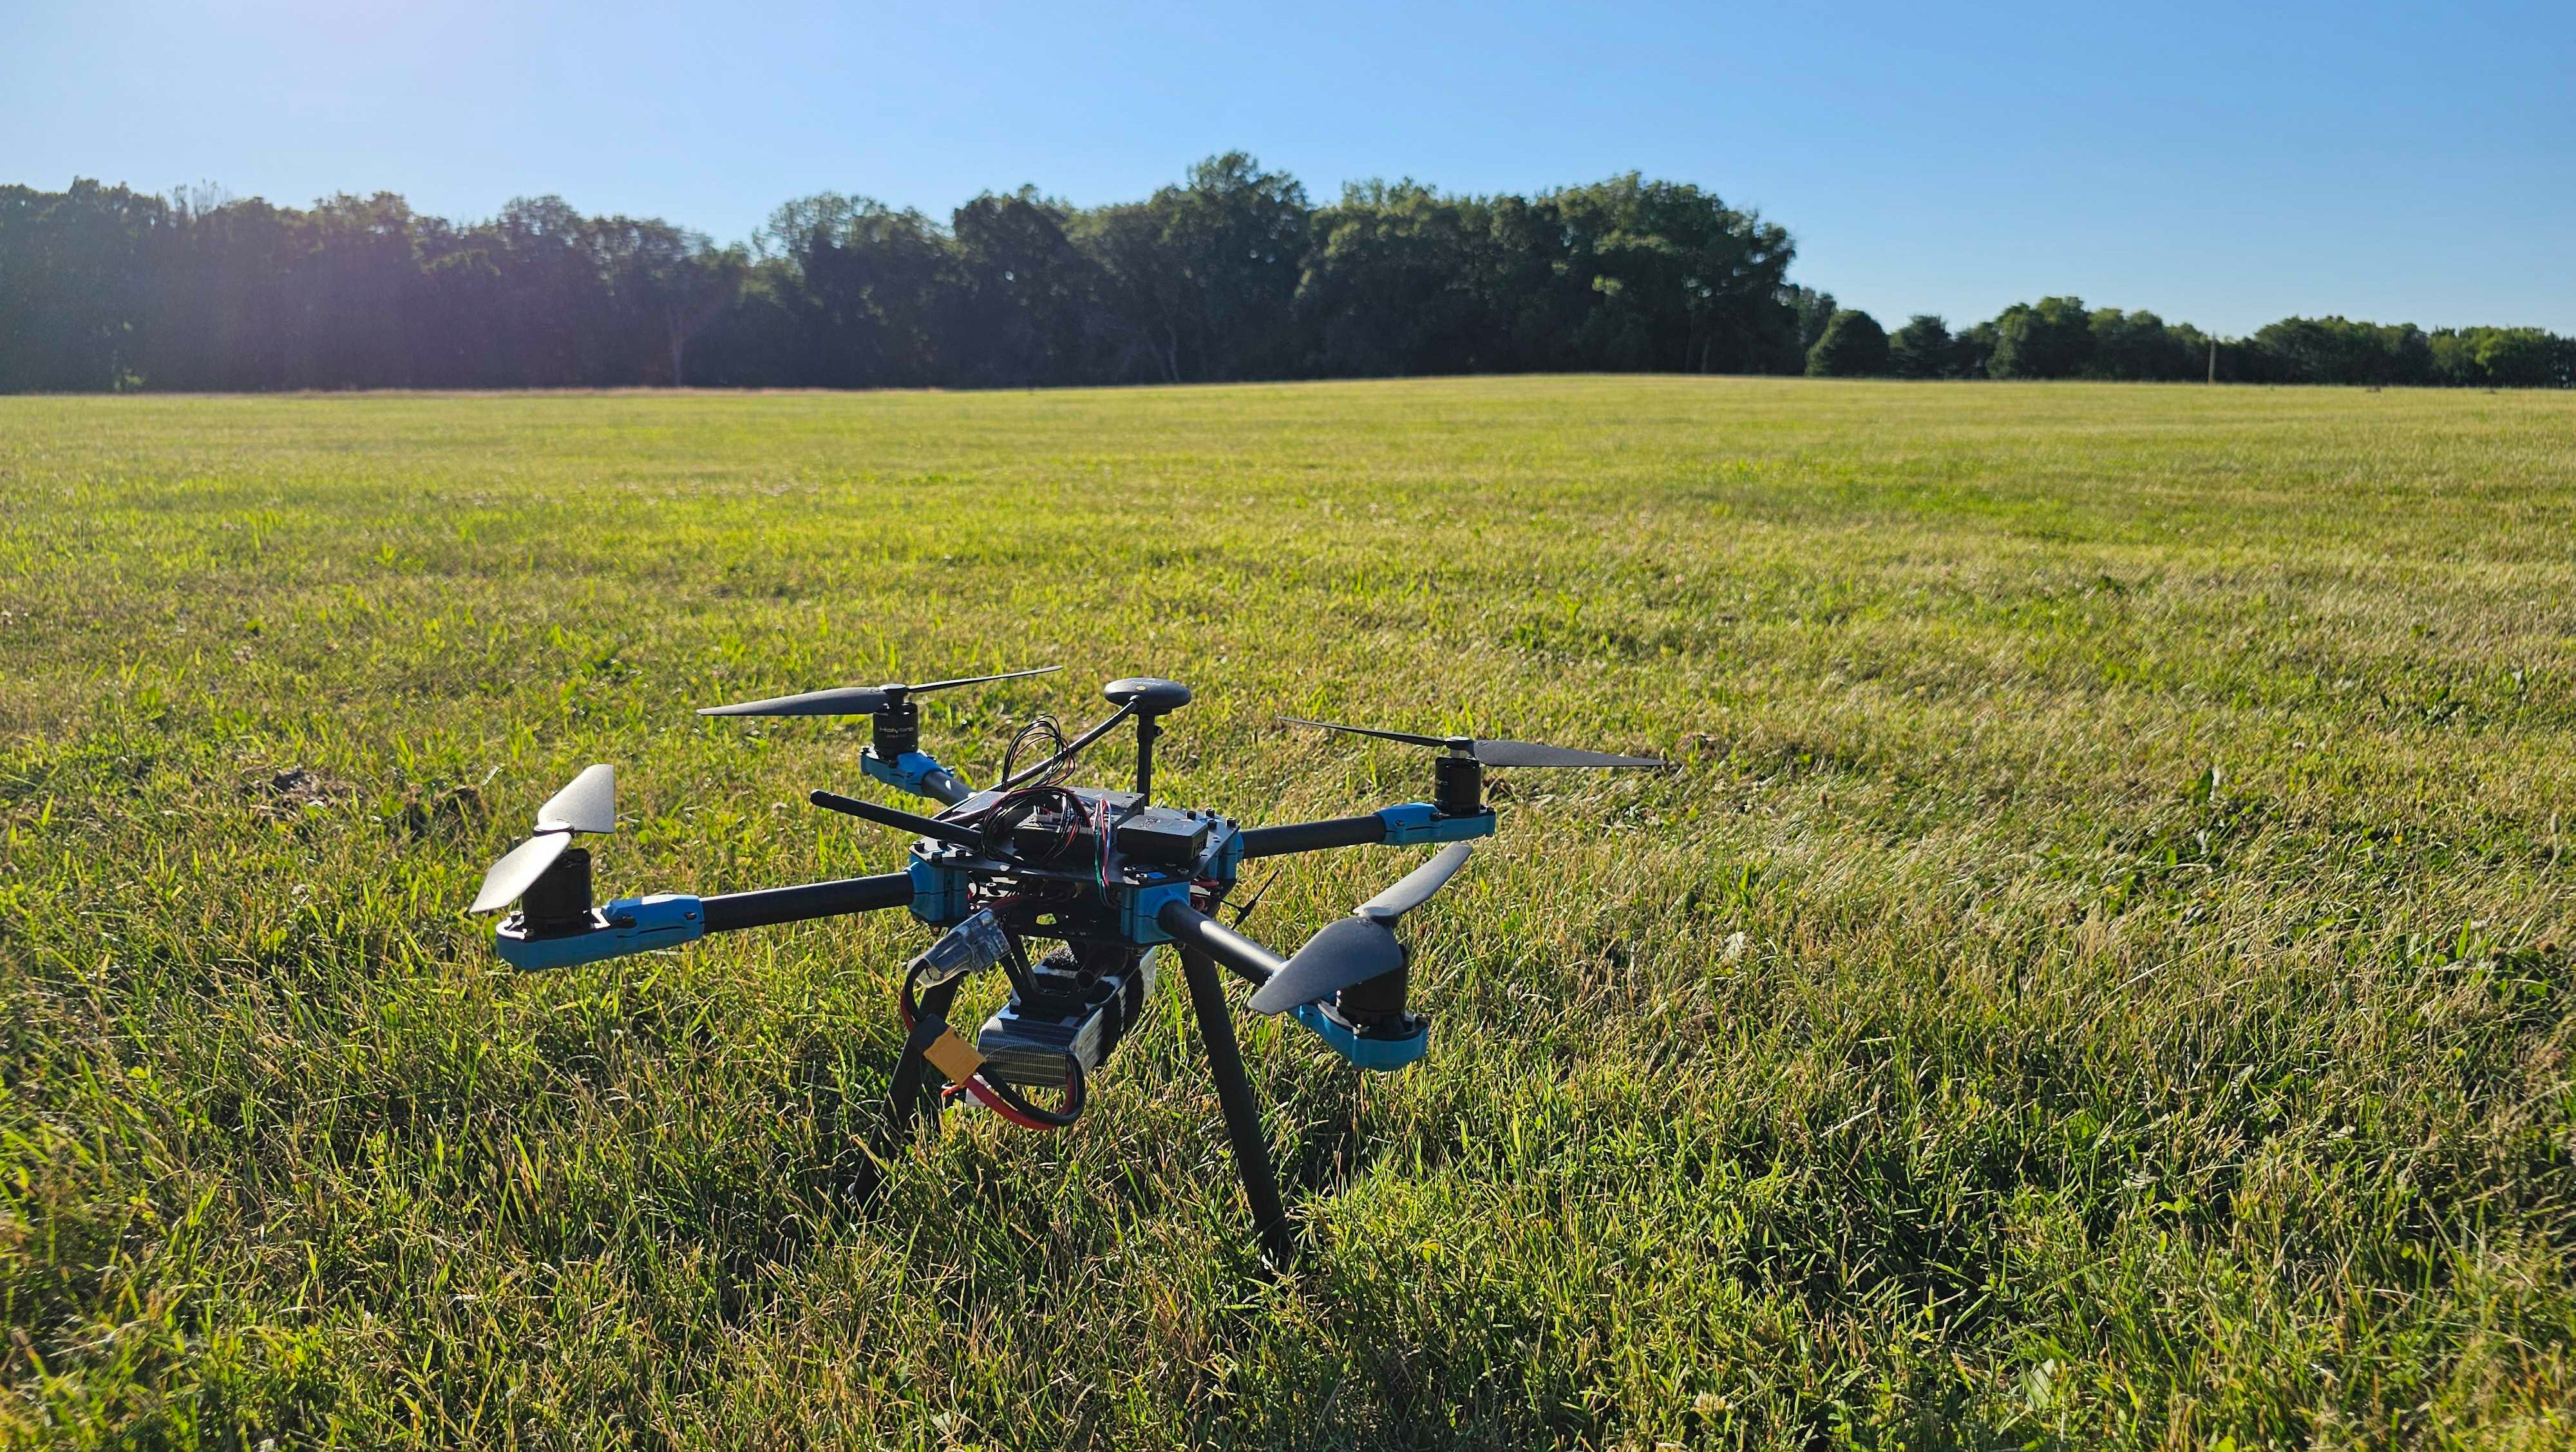
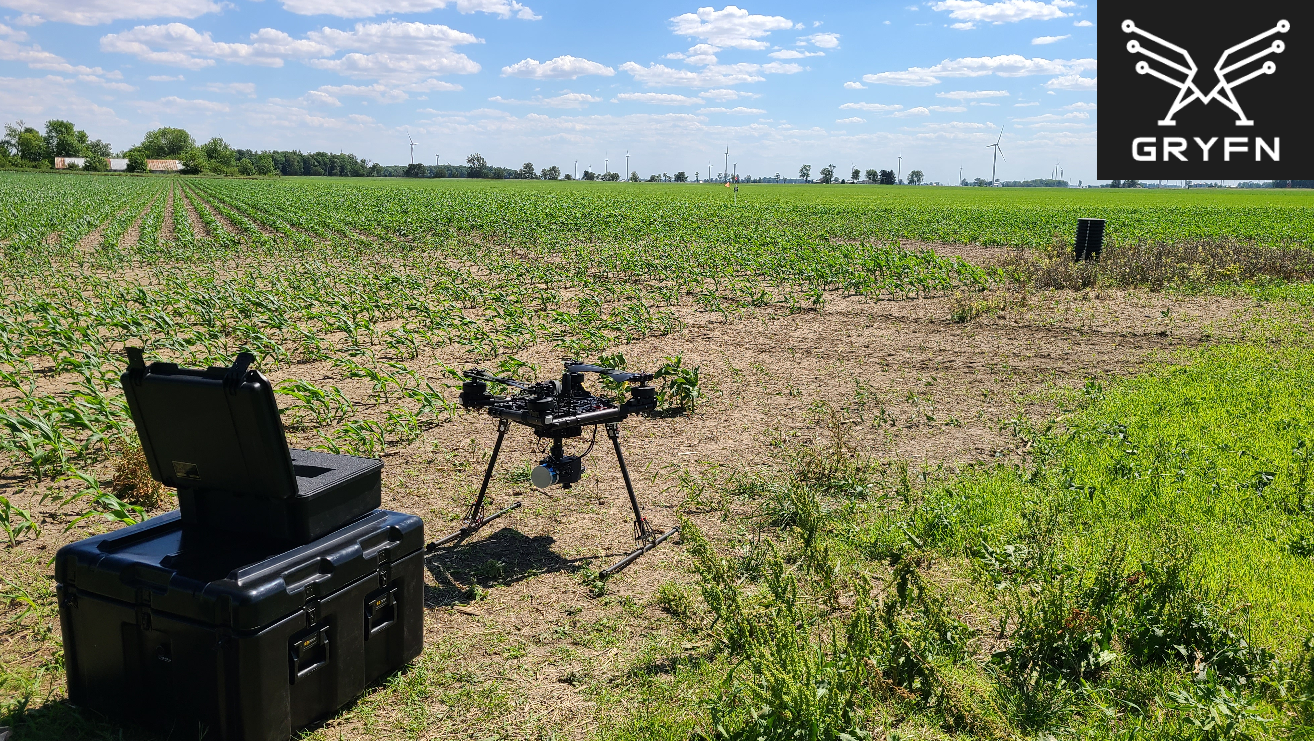
The next option, that is typically less cost prohibitive, and can capture the highest spatial resolution are unmanned aerial vehicles (UAVs). UAVs can fly at a low altitude over an area of interest and can collect sub-centimeter. UAVs also have the benefit of operating below the clouds and collecting data on a more frequent basis. UAVs themselves are much less expensive to own and maintain than a manned aircraft and could be operated by the same person interested in the data, instead of needing to hire an external pilot. UAVs are not right for every situation, however. UAVs are limited often in the area they can cover, and the weight of sensors they can carry.
The limitations of aircraft are worth the tradeoff for all interested in collecting data at a rapid rate. Temporal resolution refers to the period of time between data collection. The smaller time period between data collection, the higher the temporal resolutions. Aircraft can be scheduled to fly an area more frequently, and work around weather conditions to ensure high quality, while satellites have periods of long orbits, and can’t simply work around weather conditions. The cost of manned aircraft operations use to limit many to using satellite data regardless though, and so despite the limitations of UAVs a large market has begun to grow around their usefulness over the last several years.
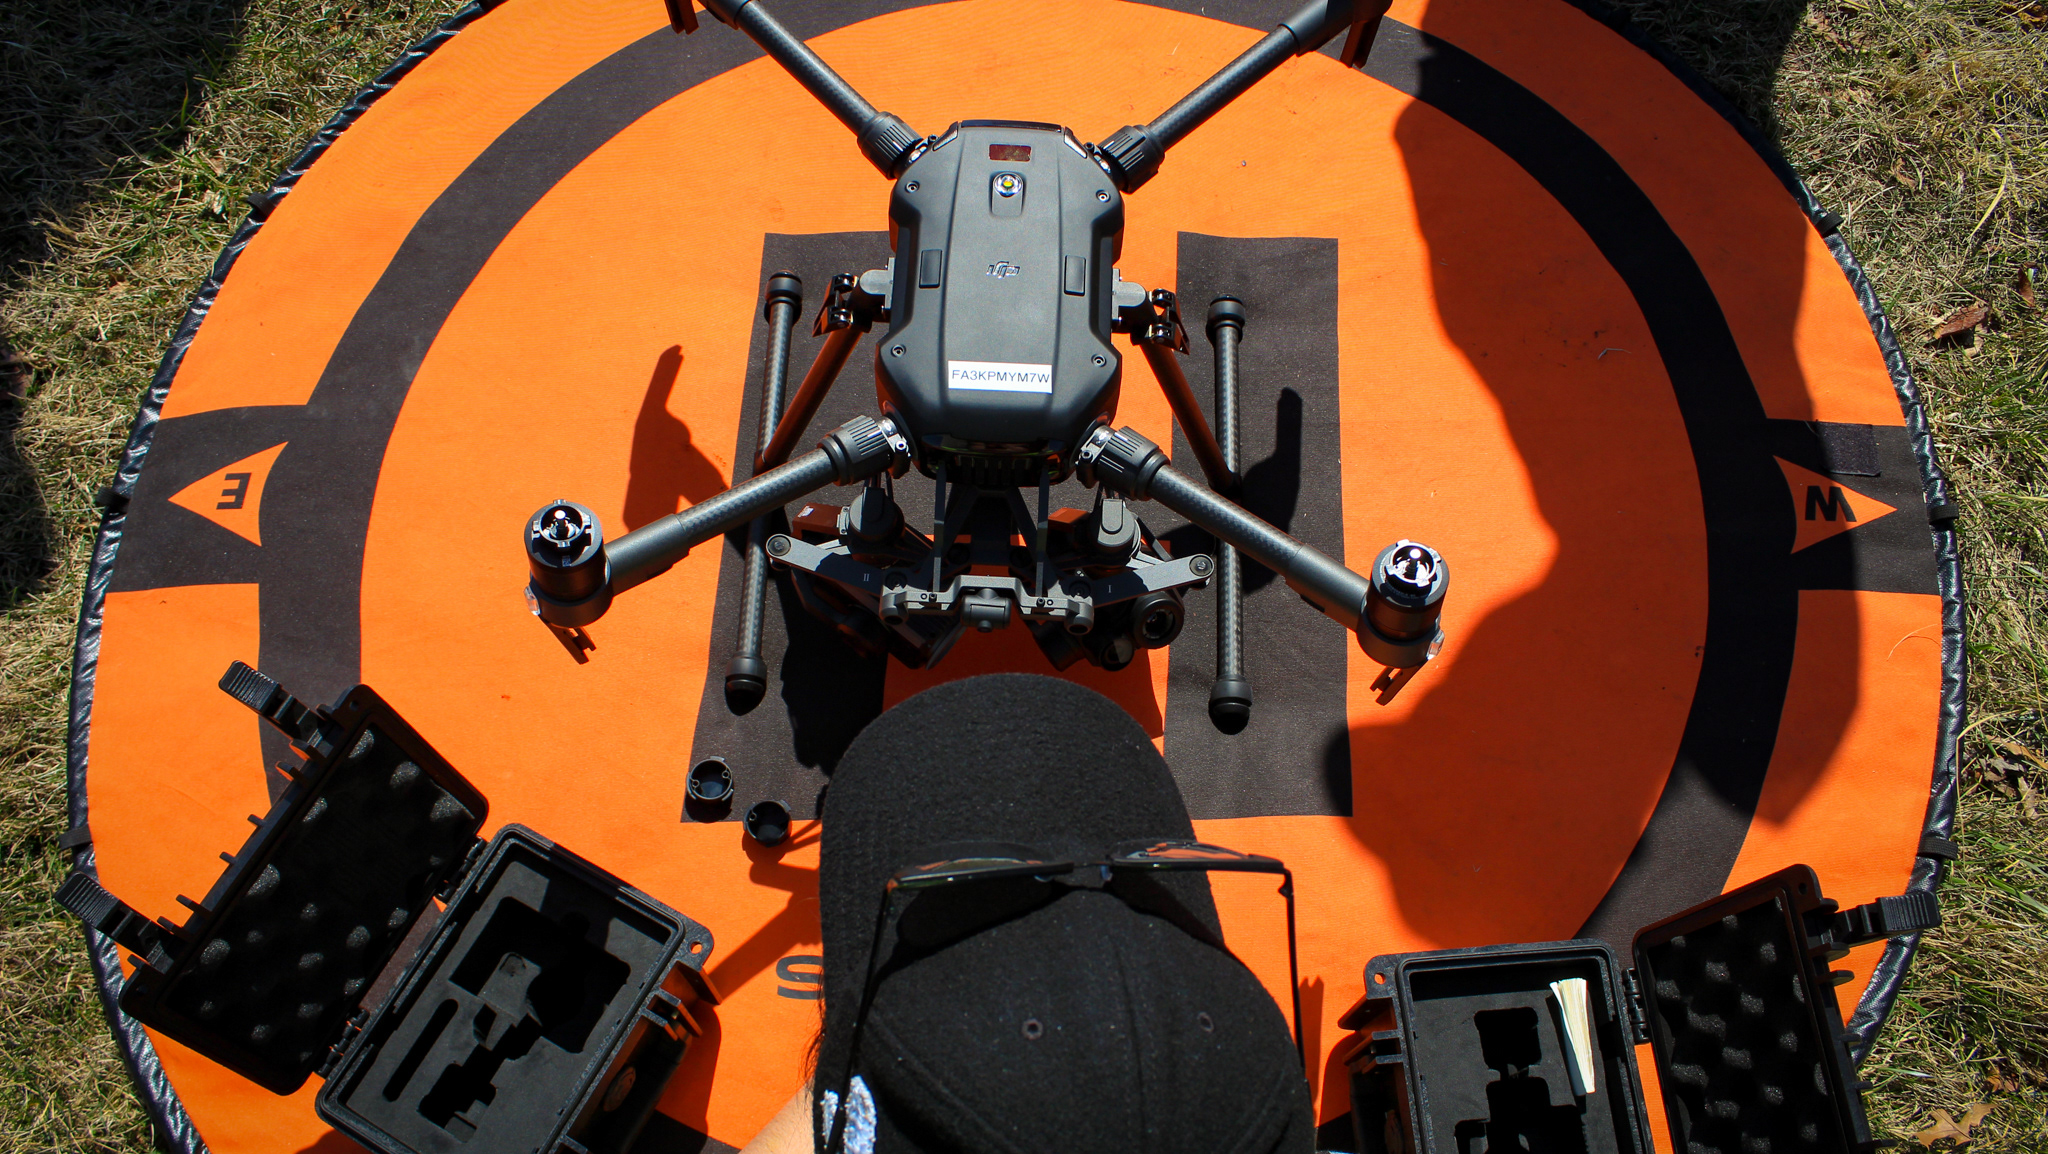
Over the last three years I have worked for a company that specializes in UAV based remote sensing. I’ve had hundreds of hours of operational time collecting simultaneous RGB, LiDAR, thermal, and hyperspectral data. Additionally, I’ve been responsible for data processing and analysis. So, for the continuation of this paper, I will be referring to the difference of multispectral and hyperspectral remote sensing through the lens of UAV based operations.
What are Multispectral Sensors?
Multispectral sensors allow us to obtain data on reflected energy that is outside the visible light spectrum. Everything we see is part of the electromagnetic spectrum within the visible light range of 380nm-700nm. This of course is not the entire range of the electromagnetic spectrum, however, to be able to see the energy reflected outside of that range we need specialized sensors. You can think of this in the same way as an x-ray machine, which allows us to see through the human body in a non-invasive way. For multispectral sensors the solution is to have a specific camera capture reflected energy within a specific swath of bands. Take the example of the Micasense RedEdge-P. It has five camera sensors specifically for different sections of the electromagnetic spectrum (Table A) (RedEdge-P - Drone Sensors).
It captures this data simultaneously through its independent cameras as independent images. These images can be evaluated on their own to see how much energy is reflected within a specific band range. Once a flight has been completed all of these images can be compiled into a multi-layered orthomosaic image. Orthomosaics are the result of stitching together multiple images with matching features to generate a singular large image (or raster) of an area. In the world of agriculture, a common product of such calculations is creating indices that show the strength of certain characteristics of plants in a field with the most common one known as the Normalized Difference Vegetation Index (NDVI). NDVI shows how healthy vegetation is on a scale of negative one to positive one. Vegetation strongly reflects near infrared light but absorbs red light. Using these values the NDVI formula shows us which plants in the data have strong amounts of chlorophyll, which generally means the plant is healthy.
In addition to the five independent bands, Table A shows a sixth panchromatic sensor on the RedEdge-P. The primary purpose of the panchromatic sensor increases the resolution of the other 5 sensors to a much higher quality than they are capable of on their own (Table B). This is due to the difficult technical nature of the creating hardware that can accomplish this data collection in a relatively small package. In the future there may not be a need for a panchromatic sensor to be part of the array of sensors (RedEdge-P - Drone Sensors).
What if we want to see more parts of the electromagnetic spectrum? To accomplish this, we could add more sensors to our hardware package, or add a secondary piece of hardware that has additional sensors. The previously mentioned company, Micasense (now a part of AgEagle), has done this before by offering a “blue light” option of their sensors in the past. They would sell a customer both the standard product, and then a secondary one that could see additional bands. However, this is where you can choose to deviate from multispectral sensors and go with a hyperspectral sensor.
What are Hyperspectral Sensors?
Hyperspectral sensors, like multispectral sensors, capture data outside the visible light spectrum. The primary difference between multispectral, and hyperspectral, is that multispectral gathers specific bands of light while hyperspectral gathers all bands within a certain range. As an example, the Headwall Nano HP gathers data from the 400-1000nm range. In this range 340 individual bands are collected, or roughly a specific band of light every ~1.76nm. This data is collected in one singular “image”, unlike the individual images from each spectral band of multispectral sensors (Nano HP (400-1000nm) Hyperspectral Imaging Package).
With our example sensor there is another characteristic that makes it different from multispectral sensors in the way data is collected. Instead of taking an image like we understand, the Nano HP is a line-scan camera. Being a line-scan camera leads to the collection of a single line of pixels over a period of time. A comparison you may be familiar with, is taking a panorama photo on your phone. To take a panorama you move your camera to generate the picture. If you take a long panorama, on your phone it could look like a long rectangle in your photo viewer. When using a hyperspectral sensor on something like a Unmanned Aerial System (UAS), these rectangular images are what you would get. This includes any of the motion blur or artifacting from the movements of the UAS, in the same way as if your hand was shaky in taking a panorama.
This isn’t to say no frame-camera style hyperspectral sensors exist. They certainly do, and an example of one is the Ultris X20 from Cubert Hyperspectral. This is a lightweight and compact UV-VIS-NIR hyperspectral camera. It has lower spectral resolution, 164 bands, and a much lower spatial resolution of 410 x 410px. However, thanks to its small size, makes it versatile with a variety of use cases requiring minimal setup, and better stationary use. This type of sensor also produces standard images, which may be more useable in your workflow. (Cubert Video Spectroscopy).
So, from the Nano HP you get “images” that are 1024 pixels wide and as long as the data is recorded. This “image” can then be broken down into up to 340 individual bands. These bands exist within the visible light range from violet (400nm) to red (700nm) up through red edge and into the near infrared range (1000nm). So, at the cost of some spatial resolution, you gain a lot of spectral resolution compared to multispectral sensor. Though with this lower spatial resolution, and collection of a large swatch of the electromagnetic spectrum the data can be quite noisy, especially depending on how the data is post-processed. The other cost is price. Hyperspectral sensors are consistently priced higher than multispectral sensors. Additionally, hyperspectral data collection requires much more data storage capacity, and depending on use case can require a much more powerful computer to handle processing or working with the data.
Conclusion
So which sensor might be right for you? The best way to think about it is that hyperspectral sensors like the Nano HP are excavators, while multispectral sensors are like shovels. Hyperspectral sensors collect a vast amount of data, which is great for a variety of research style purposes, however a large amount of that data is likely not useful to you. Multispectral sensors don’t cover as much of the electromagnetic spectrum but will get you a much more manageable amount of data to work with, with the added benefit of higher spatial resolution in most cases.
If you are unsure what might be the right answer for you or your organization, here are my suggested steps. First start doing research with a hyperspectral sensor in smaller controlled environments. From here you can begin to dissect the vast amount of spectral data, collected in limited quantities. You then might identify 3 -6 specific spectral bands you are interested in. You can then work with a provider of special cameras and camera filters to put together a multispectral camera that captures those specific bands you are interested in. You can then distribute these multispectral cameras at scale and begin collecting data on a much larger scale and with broader variety.
Sources
Cubert Video Spectroscopy. (n.d.). Cubert-GmbH. https://www.cubert-hyperspectral.com/products/ultris-x20
Nano HP (400-1000nm) Hyperspectral Imaging Package. (n.d.). Headwall Photonics. Retrieved May 13, 2024, from https://headwallphotonics.com/products/remote-sensing/nano-hp-400-1000nm-hyperspectral-imaging-package/
RedEdge-P - Drone Sensors. (n.d.). AgEagle Aerial Systems Inc. https://ageagle.com/drone-sensors/rededge-p-high-res-multispectral-camera/
US Department of Interior. (n.d.). Landsat 8. Landsat 8 | U.S. Geological Survey. https://www.usgs.gov/landsat-missions/landsat-8
US Department of Interior. (n.d.). What is remote sensing and what is it used for?. What is remote sensing and what is it used for? | U.S. Geological Survey. https://www.usgs.gov/faqs/what-remote-sensing-and-what-it-used
